
8 Supply Chain KPIs That Prove Where Your Operation Wins and Loses
7 min read

Key takeaways
- A KPI changes a decision only when you can trace it to a lever you control and trust the data behind it. Most supply chain metrics fail on the second part.
- Formulas are the easy part. The benchmark that matters most is your own trend, because ranges swing hard by industry.
- The yard and dock are the common blind spot. Gate and dock timestamps sit inside OTIF, dwell, detention, cycle time, and cash-to-cash, and most teams measure those metrics without them.
- Clean check-in, check-out, and document data turns these KPIs from scorecards you explain into decisions you can make.
Every operation tracks KPIs. But far fewer act on them. A number on a dashboard changes a decision only when two things are true: you can trace it to a lever you control, and you trust the data underneath it.
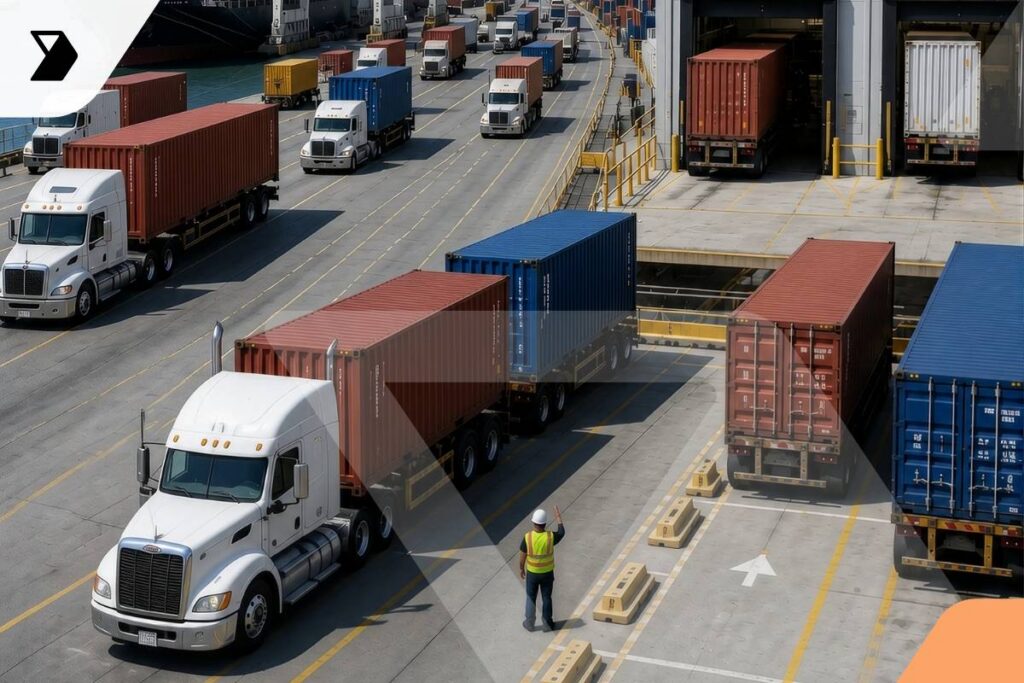
Most supply chain metrics pass the first test and fail the second. The formula is standard, the target is roughly known, and the data feeding it might be stitched together from systems that never see the whole journey. The biggest gap is usually the yard and the dock, where hours go uncounted, and timestamps get keyed in by hand.
This guide walks through the eight KPIs that most often drive decisions. For each, you get the formula, a realistic range, the lever that moves it, and the yard-and-dock supply chain data most teams miss when they try to measure it.

Ready to transform your supply chain?
Increase efficiency and productivity. Say goodbye to delays, handwriting errors, and time-intensive manual data entry.
1. On-Time In-Full (OTIF)
OTIF is the headline service metric, and it asks one question: did the order arrive complete and on schedule? Miss on either count and it doesn’t count.
Formula: OTIF % = (orders delivered on time and in full ÷ total orders) × 100
Benchmark: Many shippers target 95% or higher. Major retailers set their own thresholds and charge penalties below them, so the real bar is often your largest customer’s contract. Below about 90% points to a systemic issue.
What moves it: Appointment adherence and dock scheduling. A load can run a perfect lane and still miss its window because the dock wasn’t ready.
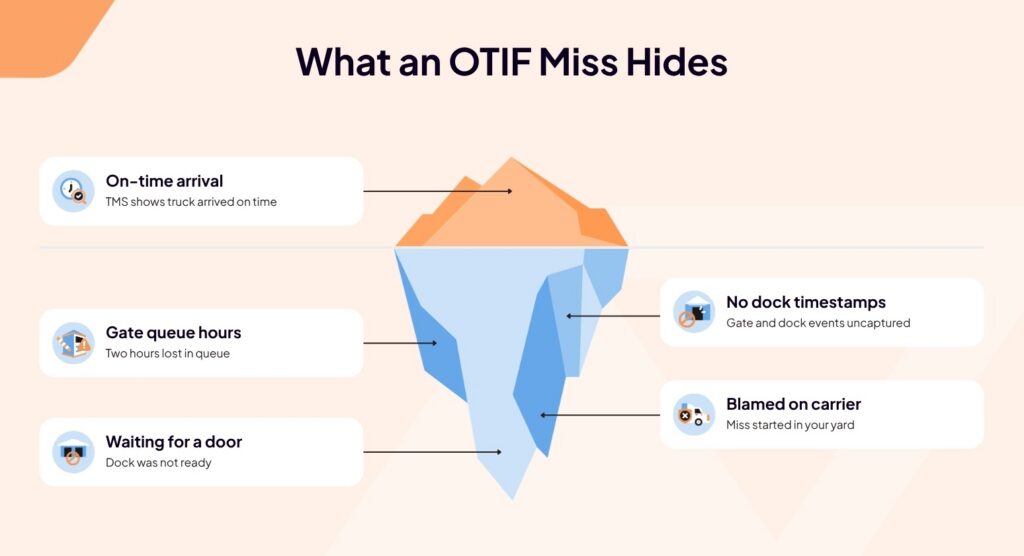
The yard and dock data you’re missing: Where the order actually went late. A TMS shows the truck arrived on time. It rarely shows the two hours lost in the gate queue or waiting for a door. Without gate and dock timestamps, an OTIF miss looks like a carrier problem when it started in your yard.
2. Dwell Time
Dwell is how long a trailer sits in your yard before it gets worked. It’s the quiet driver behind detention, and it’s the metric most often measured wrong.
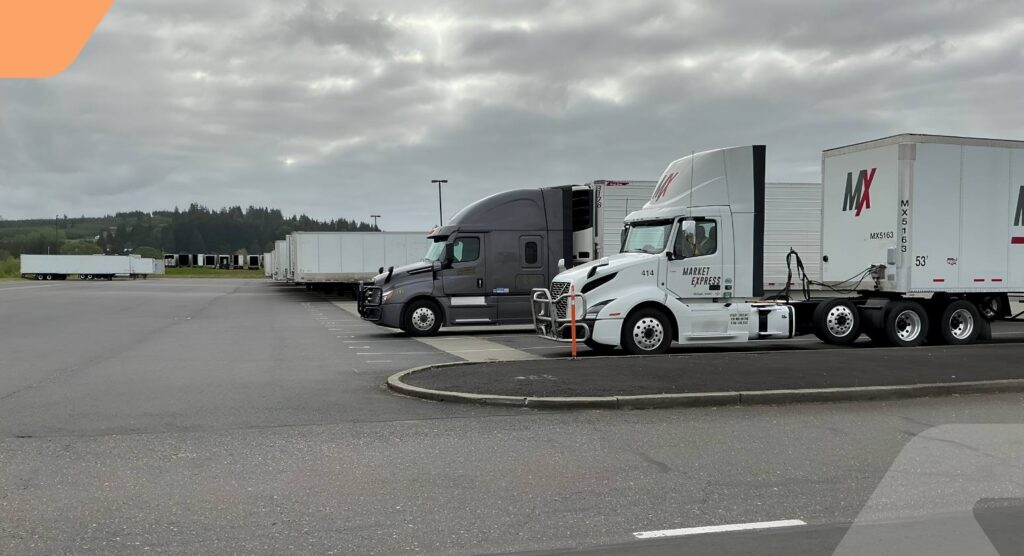
Formula: Dwell = departure time minus arrival time, averaged across trailers.
Benchmark: There’s no universal number, but keeping a driver under two hours is a common goal, since detention usually starts after a free window of about two hours.
What moves it: Faster dock turns, spotter tasking, and knowing where every trailer sits. You can’t shorten dwell time you can’t see.
The yard and dock data you’re missing: Accurate gate-in and gate-out timestamps. Manual sign-in sheets undercount dwell and miss departures entirely, so the number you report is lower than the hours you actually burn.
3. Perfect Order Rate
A perfect order has nothing wrong with it: on time, complete, undamaged, and with correct paperwork. It’s the strictest service metric, because every failure counts against it.
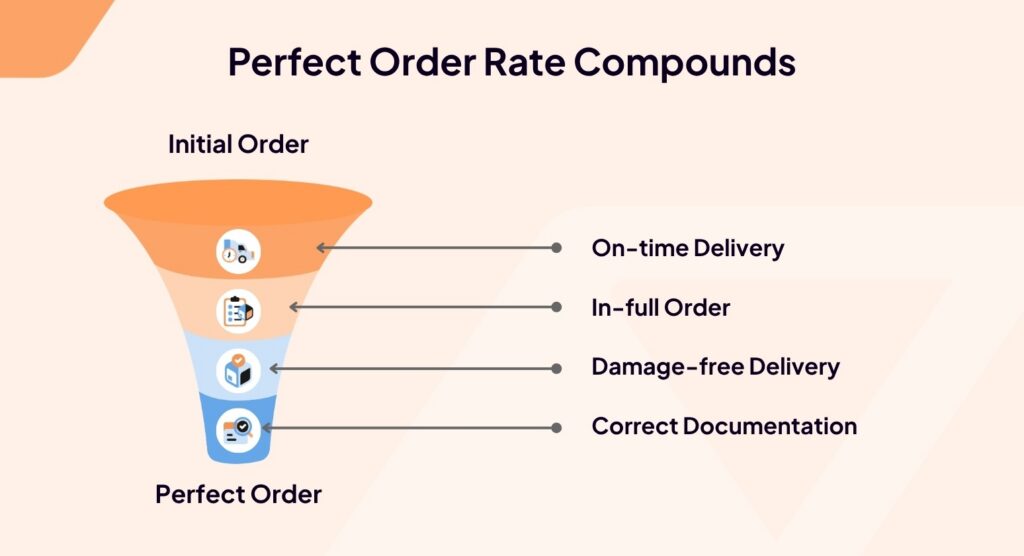
Formula: Perfect Order % = on-time rate × in-full rate × damage-free rate × correct-documentation rate. Or, simply, perfect orders ÷ total orders × 100.
Benchmark: Top performers are often cited around 90-95%. Because the components multiply, 95% on each of four factors lands near 81% overall, so the bar is higher than it looks.
What moves it: Fixing the weakest component, which is often documentation. A shipment can be on time and complete and still fail on a wrong or missing bill of lading.
The yard and dock data you’re missing: Document accuracy and damage capture at the point of loading. Correct paperwork and damage-free status are both decided at the dock, and data errors caught there never become a failed order downstream.
4. Inventory Turnover
Turnover shows how many times you sell and replace inventory over a period. Higher turns mean less cash tied up on the floor.
Formula: Inventory Turnover = cost of goods sold ÷ average inventory.
Benchmark: Heavily industry-dependent. Grocery and fast-moving goods can run well into the teens, while heavy equipment may sit around four to six. Compare against your sector, not a single number.
What moves it: Demand planning and thinner safety stock. Buffer stock is padding for uncertain inbound, so reliable arrivals let you hold less.
The yard and dock data you’re missing: Trustworthy inbound timing. When planners can’t rely on arrival data, they pad every number to be safe. Gate and shipment visibility data shrinks the buffer it takes to avoid a stockout.
5. Cash-to-Cash Cycle Time
Cash-to-cash measures the days between paying your suppliers and collecting from your customers. It ties operations straight to the balance sheet.
Formula: Cash-to-Cash = days inventory outstanding plus days sales outstanding, minus days payables outstanding.
Benchmark: Ranges vary widely, and the strongest operators push it toward zero or even negative, collecting before they pay. Track your own trend rather than chasing a fixed target.
What moves it: Faster invoicing and collections, and less inventory. The invoice can’t go out until the delivery is proven.
The yard and dock data you’re missing: How long the document takes to close. A proof of delivery that sits in a driver’s cab for days delays the invoice and stretches the cash cycle. Capturing the POD at the dock and starting billing from the delivery event pulls days out of your receivables.
6. Detention and Demurrage Spend
Detention is what carriers charge when a trailer sits past its free time at your dock. Demurrage is the equivalent at ports and rail. Both are pure cost, and both are often overpaid.
Formula: Detention spend = the sum of (hours past free time × hourly rate) across loads. Demurrage follows the same shape at the port.
Benchmark: There’s no target to hit, only a direction, which is down. Track spend per load and per facility so you can see where it concentrates.
What moves it: Shorter dwell, faster turns, and disputing charges you can prove are wrong. Half the battle is contesting detention charges that don’t match what actually happened.
The yard and dock data you’re missing: Timestamped proof of arrival and departure. Without clean gate records, you can’t contest a bill, so you pay it. The data that lowers dwell is the same data that wins the dispute.
7. Trailer Turns
Trailer turns measure how many times a trailer or dock door completes a full cycle in a period: in, worked, and back out. It’s an asset-utilization metric that tells you whether your doors and equipment earn their keep.
Formula: Trailer Turns = loads processed ÷ number of doors, over a set period, often expressed per door per day.
Benchmark: Higher is better, and the right number depends on your door count and volume. Track it per door per day and trend it rather than benchmarking against another operation.
What moves it: Faster unload and reload, efficient spotter moves, and less time hunting for trailers.
The yard and dock data you’re missing: Real-time trailer status and location. You can’t turn a trailer you can’t find, so yards that manage trailer pools on a spreadsheet leave turns on the table.
8. Order Cycle Time
Order cycle time is the clock from order placed to order delivered. It’s what your customer actually feels, and it rolls up delay from every stage.
Formula: Order Cycle Time = delivery date and time minus order date and time, averaged across orders.
Benchmark: It varies by lane and mode, so benchmark against your own history and your customers’ expectations, not an industry average.
What moves it: Removing delay at each stage. The overlooked chunk is the time inside the facility, between arrival and the dock.
The yard and dock data you’re missing: The hours that hide inside “arrived at facility.” Most cycle-time analysis stops when the truck reaches the gate and misses what happens after. Clean gate check-in and dock timestamps put those hours back on the clock, where you can cut them.
How Vector Helps You Turn Your Yard Data Into KPIs You Can Act On
OTIF, dwell, detention, cycle time, and cash-to-cash all depend on when a trailer arrived, when it was worked, and when it left. Most operations capture those moments on a clipboard, or not at all.
A yard management system that records gate and dock events cleanly turns each of these KPIs from a scorecard you explain into a decision you can make.
Vector captures these metrics cleanly at the gate and the dock, so the numbers your team reports hold up and point to a cause:
- Gate Check-In and Check-Out: Vector PreCheck® records arrivals and departures at the gate, so dwell, detention, and cycle-time clocks start and stop on real events.
- Real-Time Trailer Tracking: Continuous trailer visibility without RFID tags or costly hardware, so trailer turns and dwell run on live location instead of a spreadsheet.
- eBOL From BOL to POD: A timestamped digital record of every delivery, so billing starts from the delivery event and days come out of your cash cycle.
- Detention Evidence: Timestamped proof of arrival and departure, so you contest inaccurate detention charges instead of paying them.
- Connected Integration: Yard and document data flow into the WMS, TMS, and ERP you already run through API, EDI, and email, so your KPIs read from one clean source.
See how Vector runs the yard and feeds the metrics your team reports on.
FAQs
Which Supply Chain KPI Should You Start With?
Start with the one your business feels most, then check whether you actually trust its data. For most facilities, that is dwell or OTIF, because both are painful, both tie to cost, and both usually rest on gate timestamps that are captured by hand. Fixing the data under one metric tends to clean up several at once, since they share the same arrival and departure events.
Why Do KPI Benchmarks Vary So Much by Industry?
Because the underlying business models differ. Grocery turns inventory far faster than heavy equipment, and a retailer’s OTIF threshold is stricter than a bulk commodity shipper’s. A single industry-wide number hides more than it shows, so the more useful benchmark is your own trend over time and the specific targets your largest customers hold you to.
How Does Yard Data Change These KPIs?
Five of the eight- OTIF, dwell, detention, cycle time, and cash-to-cash- depend on when a trailer arrived, when it was worked, and when it left. If those moments are logged on a clipboard, the metrics built on them are estimates. Clean gate and dock timestamps make the numbers accurate and, more useful, traceable to a cause you can fix.
What Is the Difference Between Detention and Demurrage?
Detention is the fee a carrier charges when its trailer sits at your facility past the agreed free time. Demurrage is the equivalent charge for containers held too long at a port or rail terminal. Both start with a clock, and both are easier to lower and to dispute when you have timestamped proof of when the asset actually arrived and left.
Published on September 09, 2026
Last updated on September 09, 2026
Subscribe to stay updated on Vector and logistics trends
" " indicates required fields

Continue reading


Ready to transform your supply chain?
Increase efficiency and productivity. Say goodbye to delays, handwriting errors, and time-intensive manual data entry.