Supply Chain Performance: 6 Helpful Metrics to Track
In the post-pandemic era, we've seen a shift in narrative when it comes to supply chain performance. There's no question that things are different now.
Ready to transform your supply chain?

But everyone wants to know: How will the supply chain perform in the future?
So today we’re investigating some key performance indicators (KPIs) that offer insight into supply chain performance. How do we know how and where things are going? Are there any metrics we can track? Of course! We’ll look at six KPIs I like to track.
These KPIs will touch on some of the obvious things, although hopefully with a fresh take. But we’ll also look at a few KPIs that offer a different perspective. After all, if we’re calling it the new abnormal, we should probably be thinking outside the box. Let’s go!
The Grand Narrative of Supply Chain Performance
The narrative surrounding overall supply chain performance has shifted. In my opinion, this shift occurred the moment people were faced with one particular supply chain performance failure. And honestly, this event created a huge uptick in global anxiety.
I’m speaking of course, of the great toilet paper shortage of 2020! Black Friday–style fights at the store in March. Vast scores of the populace forced to use one-ply for awhile. It was terrible!
Yeah, it all seems humorous now, doesn’t it? But we were legitimately concerned!
I think of that moment as our collective baptism by fire. It was the start of the new abnormal. The supply chain crisis kept evolving in surprising, newsworthy, and, yes, humorous ways. After toilet paper, it was semiconductors.
The semiconductor shortage led to a side narrative about all the products left partially constructed due to the lack of missing key components. That included not just chips but also tires, hydraulic tubes, and batteries.
But it made us all wonder—why so many delays?
I remember hearing a story from a friend about furniture they ordered online that took nine months. She asked, “Are we conceiving a baby here, or ordering a bookshelf?”
Beyond that we wondered, when did everything start costing more? If you’ve been tracking gasoline, beef, bitcoin, or dogecoin—prices have either crept upward or in some cases shot to the moon.
We love tracking things. I have a feeling that human love for tracking data and foraging through spreadsheets is a vestigial skill that harkens back to our human hunter-gather origins. It may be why you’re here reading this! Hopefully, I can offer a bounty of wisdom for you to bring back to your tribe.
Let’s get into these supply chain performance KPIs!
On-Time Deliveries
You already know about on-time deliveries (OTD). We’ve been tracking them forever. That’s still valid. A trend line of on-time deliveries is a good snapshot of a supply chain company’s overall health. This is generally true regardless of your niche in the supply chain.
For example, if you’re a carrier or 3PL, then on-time, in-full deliveries indicate your overall performance. And that’s of course tied to your bottom line.
A retailer like Walmart has used a 95 percent benchmark in the past. I’ve seen it listed as 97.5 percent for time-sensitive food freight. Walmart simply wouldn’t work with carriers that couldn’t clear that bar. So, let’s mark that down as our first KPI.
- KPI #1: 95 percent to 97.5 percent on-time, in-full deliveries
More recently, we’ve seen a market fraught with delays and inefficiencies. In turn, we know shipments not delivered on-time, in-full can get dinged by penalty charges. No carrier likes giving back margin. But on the flip side, no business likes dedicating time and resources to chargebacks and deduction disputes.
Late Delivery Costs
Tracking on-time deliveries is an age-old supply chain performance metric. How about the cost of missing that 5 percent? What does the dispute process for late deliveries cost you in real terms?
- KPI #2: Late delivery costs
It also may be useful to track what late charges mean in soft terms. In other words, how are missed deliveries challenging your customer relationships? A bad trend on missed deliveries has a way of souring a good business relationship. It can put your entire value proposition under the microscope.
I like the way Eric Smith spells out this issue in this talkbusiness.net interview: “Invoice deductions are a universal pain for retail suppliers, and that was the number one issue they wanted to see automated given the tedious and time-consuming process of building cases for disputing the deduction claims.”
Number of Trading Partners With Synchronized Software
Paperwork is a hassle. Late deliveries are a hassle. The claims process sucks up valuable resources. So a good, forward-looking supply chain metric is the number of trading partners who use document digitization.
Why is that? Because based on this metric, you might predict the trend of future disputes as well as their corresponding hard and soft costs. As Smith alluded to, it pays to work with trading partners who are digitized.
- KPI #3: Percentage of your trading partners that use digitization software that integrates with your system
Beyond that, digitization is how you get to automation. Digitization is how you get away from manual disputes entirely. It’s how you avoid paper-laden resource traps. In general, digitization is one of the key steps toward the supply chain visibility that everyone thinks will help us sort out the supply chain crisis.
To summarize, this metric is a simple yes or no question. Do you use digitization software?
If you don’t, watch out. If you answer this question incorrectly, it could mean your account is about to get downsized.
The Number of Container Ships in San Pedro Bay
In terms of any crisis, supply chain related or otherwise, I believe we must always keep our eye on the narratives. What stories are others telling us? What stories are we telling our customers? What stories are we telling ourselves?
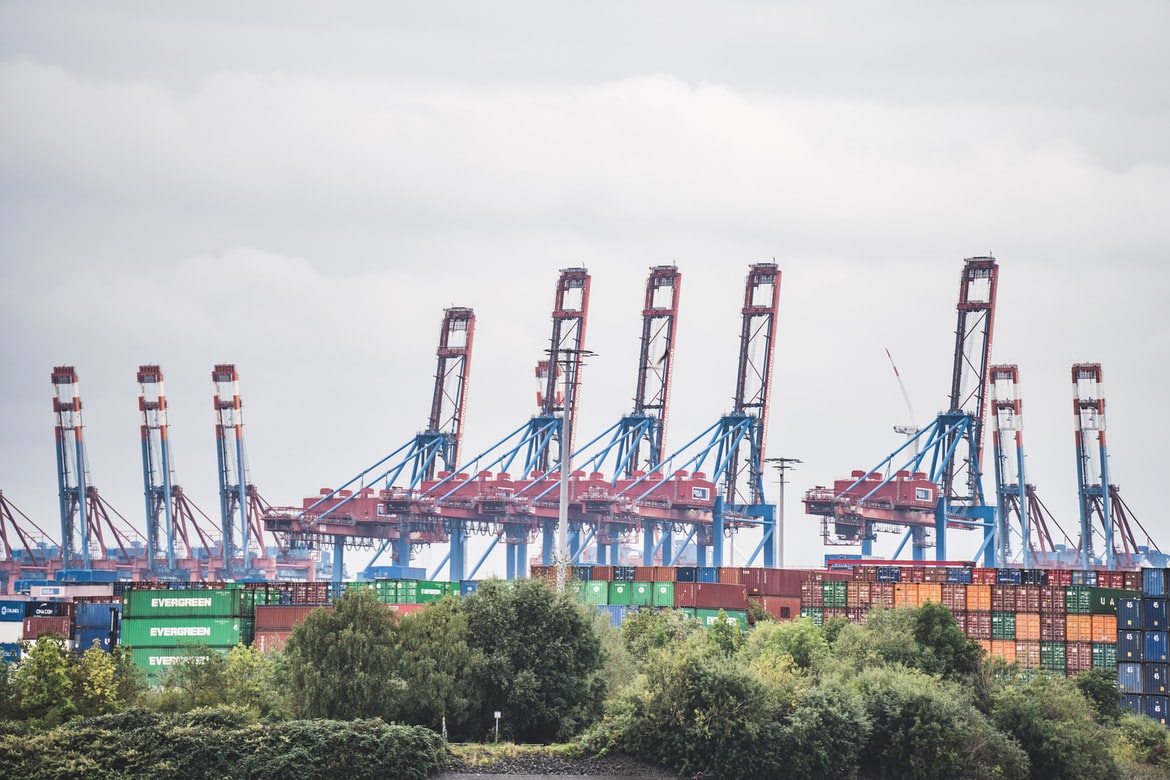
Humans are storytellers. As such, we need to be aware that the common narrative surrounding the ports of Los Angeles and Long Beach is that they’re bottlenecked messes. And they’re everyone’s fault. Now, many people understand a little better why there are shortages, delays, and price increases.
In turn, I found a great way to quickly gauge this week’s narrative. Will the news this week contain more, less, or the same amount of supply chain abnormality?
- KPI #4: The number of container ships in San Pedro Bay as a narrative leading indicator
This is a total oversimplification. But remember, it’s a gauge of what’s common knowledge. So many frantic global supply chain professionals are working harder right now. Most people don’t have time to dig any deeper or look out further.
Will suppliers raise prices further? Will things stay steady this week? Or does it look as if things are smoothing out? I don’t know—are there more boats out there or fewer?
In other words, this KPI is a quick and dirty predictor of overall health and narrative direction.
Total Landed Cost
If you’ve worked in a few areas of the supply chain industry, you know people in different departments see things differently. For example, the cost of moving a shipment isn’t always factored into the cost of subcomponents. But when you’re around logistics, you learn that more miles tend to mean higher costs, and certain lanes or destinations cost more than others.
In the manufacturing world, the logistics costs often don’t get factored into the equation at the level of piece-part pricing. In the past, a customer looking at piece-price might haggle over pennies for a month. But then you might ask that customer, “What is the difference in logistics costs when shipping from us compared to our competitor?”
Before the pandemic, you’d typically get an answer like, “Oh, that’s a different pool of money” or “Freight? That all comes from a different bucket.”
OK, fair enough. Different departments have different budgets. But when the costs for containers from Asia increased tenfold? Everything suddenly became one bucket again!
- KPI #5: Total landed cost
Nowadays, total logistics costs are high on everyone’s radar. Yes, logistics costs must be managed. But total landed cost shouldn’t just include container prices.
- What are the demurrage and detention costs of shipments held up on the dock?
- How about the costs of an assembly-line disruption?
- What’s the cost of product failing in the field, or a string of recalls?
I get that certain software systems don’t like to dual source. But haven’t we learned that supply chains optimized for efficiency are fragile? Instead, we need to optimize for resilience.
Which says nothing of the soft costs for a brand that misses the boat on a narrative push like Made in America, social movement, or environmental sustainability.
NFL Ratings
Here’s one last KPI to keep an eye on. This is another leading indicator of future trending supply chain performance. Consider the NFL and its TV ratings as a high-level gauge for the United States as we know it. In short, the NFL dominates ratings for all programming.
- KPI #6: NFL ratings
If the NFL is still happening, then the world is more or less still happening. Don’t forget: At one point during the summer of 2020, it looked as if college football would cancel its season. Baseball played a shortened season in empty stadiums. The NBA did the bubble. But the NFL? Business as usual.
For me, this felt like a “too big to fail” moment. On top of all the other NFL broadcasts, the Super Bowl is the most-watched TV event of the calendar year. It’s the last thing in America that a vast majority of us all do together at the same time. In short, as long as the NFL keeps churning out the ratings, I think we can all rely on a certain level of normal American consumption and corresponding supply chain activity.
Thanks for reading! Let us know what KPIs you find most useful.
This post was written by Brian Deines. Brian believes that every day is a referendum on a brand’s relevance, and he’s excited to bring that kind of thinking to the world of modern manufacturing and logistics. He deploys a full-stack of business development, sales, and marketing tools built through years of work in the logistics, packaging, and tier-1 part supply industries serving a customer base comprised of Fortune 1000 OEMs.
Continue reading
Ready to transform your supply chain?
Increase efficiency and productivity. Say goodbye to delays, handwriting errors, and time-intensive manual data entry.


